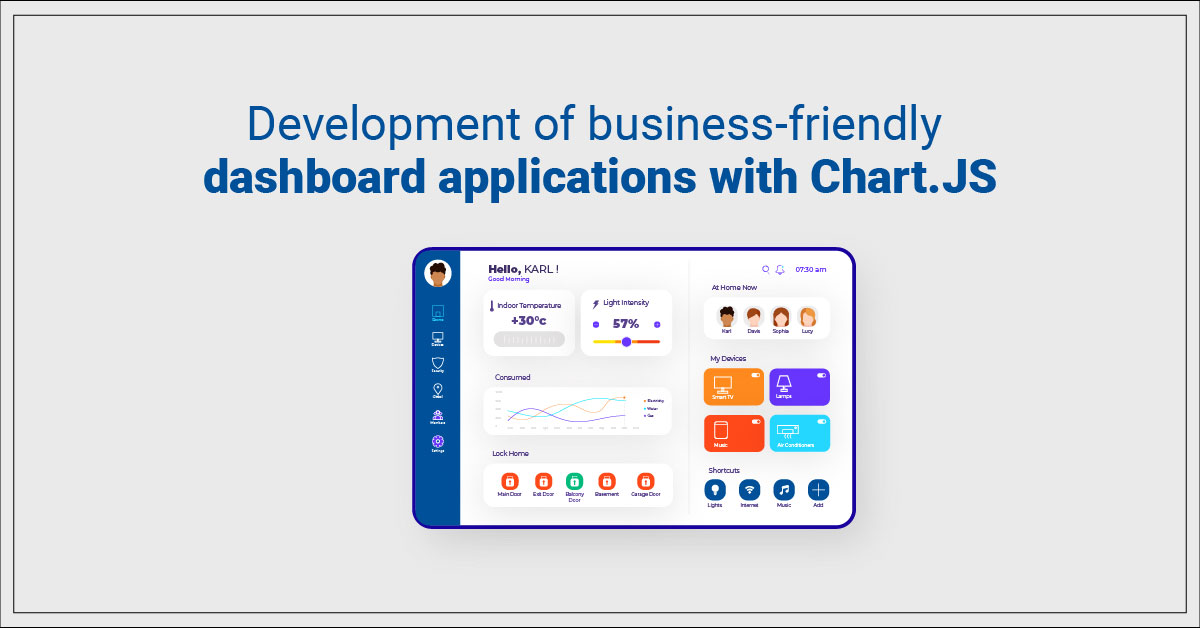
Analytics is important for business choices since it improves stakeholders' views and understanding of the data. Additionally, clients will need to construct a visually appealing dashboard for any application development, such as CRM or ERP, in order to help with business improvement decisions. Chart.js is an open-source, free JavaScript framework that facilitates the creation of 8 different types of charts, including bar, line, area, pie, bubble, radar, polar, and scatter charts. With such a broad range of chart types and customization capabilities, Chart.js is frequently used to create dashboards for software, and JavaScript integration with online applications makes it simple to use.
Having this nice visual depiction will assist viewers understand everything about their business. This display report's charts and graphs assist users acquire a general understanding of their interactions with the company. You can alter the data in a variety of ways and dynamically update the chart depending on your needs. In addition to the foregoing, it is responsive by default, meaning that its size and layout are modified to fit the container element.
Interactivity is a feature of Open Source ChartJS for Dashboard App Design & Development.
Users can interact with the charts in Chart.js to learn more about the data by seeing tooltips and hover effects. Chart.js is an open-source JavaScript technology.
Facility for Updating Data
Any element of the chart can be changed, including labels, data points, and other elements. This is especially helpful for dashboards that display real-time or dynamically changing data.
Individualized Appearance
Colors, borders, fonts, tooltips, legends, and other elements are all customizable. Additionally, the library enables transparency, patterns, and gradients.
Transitions and Animation
For rendering and updating charts, Chart.js offers fluid animations that are attractive to the eye. The charts are more interesting because of these animations, which also improve user experience.
Conclusion
We have open-source development tools that can assist you in obtaining an in-depth examination of your company using a range of data interpretation and data visualization techniques. We provide affordable IT outsourcing & web development services for all business niches from our base in India.